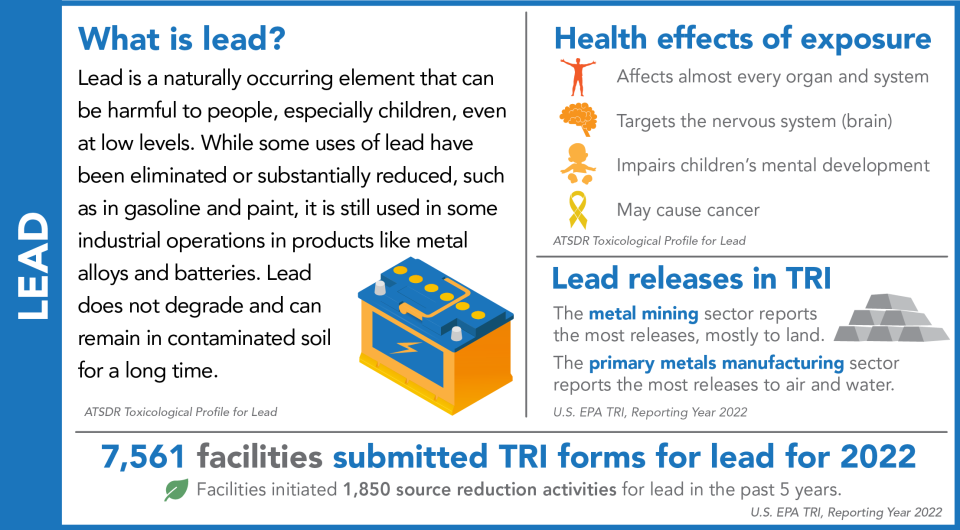
Lead
This chemical profile focuses on releases of lead and lead compounds.

Facilities report their management of both lead and lead compounds in waste to TRI. For TRI, “lead” only includes elemental lead, while “lead compounds” includes lead that is part of another chemical. Although facilities may report for lead compounds separately from lead, the two are combined and referred to simply as “lead” in this analysis.
This map shows the locations of the facilities that reported lead to TRI for 2022, sized by their relative release quantities. Zoom in to view demographic data for communities around these facilities. Click on a facility for more details on its reporting.
Click on any one of the locations on the map to see detailed information.
View Larger Map
Each year, EPA receives more TRI forms for lead than for any other chemical. This graph shows the 10-year trend in lead disposed of or otherwise released by facilities in all TRI reporting industry sectors.
Note: One parent company erroneously reported tens of thousands of pounds of lead releases to air at four facilities and has since corrected these reports. These facilities are not included in this chart.
Visit EPA’s lead homepage for more information about lead and EPA’s actions to reduce lead exposures.
Visit the Agency for Toxic Substances and Disease Registry’s ToxFAQs for lead to learn more about the effects of lead exposure and what you can do to prevent it.
From 2013 to 2022:
- Total releases of lead fluctuated between 2013 and 2022, with substantial increases and decreases from year to year.
- Land disposal by metal mines drives annual lead releases. For 2022, metal mines reported 88% of all releases of lead, almost all of which was disposed of to land.
From 2021 to 2022:
- Total releases of lead increased by 14%, driven by an increase in on site lead disposal at metal mines.
This graph shows the 10-year trend in lead released, but excludes quantities reported by the metal mining sector.
Note: Facilities from one parent company erroneously reported tens of thousands of pounds of lead releases to air at four facilities and has since corrected these reports. These facilities are not included in this chart.
From 2013 to 2022:
- For sectors other than metal mining, total releases of lead fluctuated between 2013 and 2022, and increased each year from 2019 to 2022.
- On-site disposal to land and off-site transfers of lead for disposal increased from 2013 to 2022, while air and water releases of lead decreased.
- Among sectors other than metal mining, most releases of lead came from the hazardous waste management and primary metals sectors.
From 2021 to 2022:
- Air releases, land disposal, and water releases of lead all increased, while off-site disposal decreased.
Lead Air Releases
This graph shows the 10-year trend in air releases of lead.
Note: Facilities from one parent company erroneously reported tens of thousands of pounds of lead releases to air at four facilities and has since corrected these reports. These facilities are not included in this chart.
From 2013 to 2022:
- Air releases of lead decreased by 55%. Most of this decrease comes from reduced stack emissions.
- The primary metals sector, which includes copper smelting and iron and steel manufacturing, released the largest quantities of lead to air. This sector has also been the biggest driver of reduced air releases since 2013, although lead air releases have decreased in most sectors.
- One facility ceased lead smelting operations in 2013. This facility was one of the biggest contributors to lead air releases reported to TRI, causing a substantial reduction in nationwide lead air releases for 2014 and beyond, when smelting operations had ceased.
From 2021 to 2022:
- Air releases of lead increased by 3%.
- In 2022, the primary metals sector accounted for 32% of lead released into the air.
This page was published in March 2024 and uses the 2022 TRI National Analysis dataset made public in TRI Explorer in October 2023.
