Climate Change Indicators: Climate Forcing
This indicator measures the “radiative forcing” or heating effect caused by greenhouse gases in the atmosphere.
Key Points
- In 2023, the Annual Greenhouse Gas Index was 1.51, which represents a 51 percent increase in radiative forcing (a net warming influence) since 1990 (see Figure 1).
- Of the greenhouse gases shown in Figure 1, carbon dioxide accounts for by far the largest share of radiative forcing since 1990, and its contribution continues to grow at a steady rate. Carbon dioxide alone would account for a 42 percent increase in radiative forcing since 1990.
- Although the overall Annual Greenhouse Gas Index continues to rise, the rate of increase has slowed somewhat since the baseline year 1990. This change has occurred in part because chlorofluorocarbon (CFC) concentrations have been declining, as production of CFCs has been phased out globally due to the harm they cause to the ozone layer (see Figure 1).
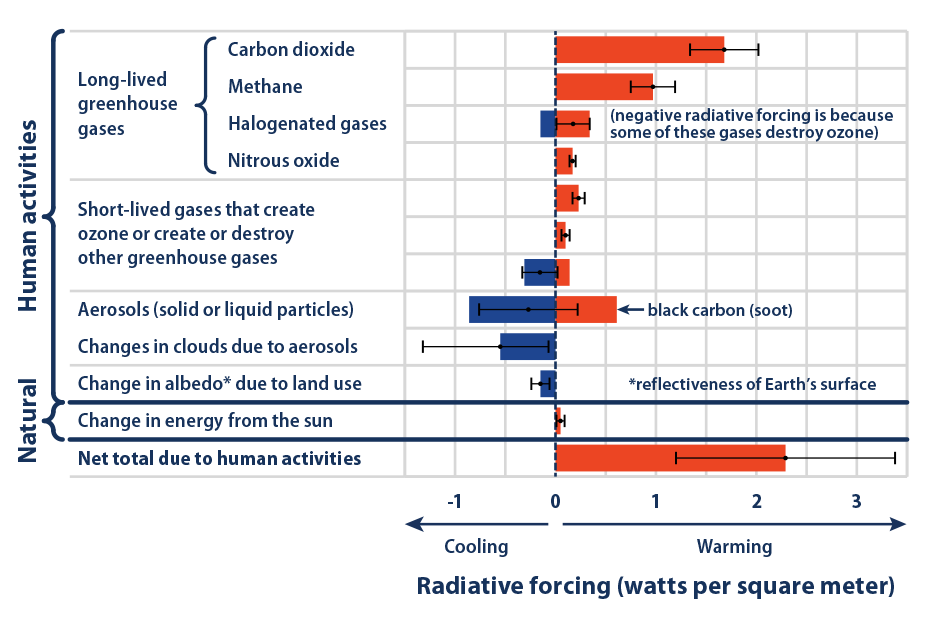
- Greenhouse gases produced by human activities have caused an overall warming influence on the Earth’s climate since 1750. The largest contributor to warming has been carbon dioxide, followed by methane and black carbon. Although aerosol pollution and certain other activities have caused cooling, the net result is that human activities on the whole have warmed the Earth (see Figure 2).
Background
When energy from the sun reaches the Earth, the planet absorbs some of this energy and radiates the rest back to space as heat. The Earth’s surface temperature depends on this balance between incoming and outgoing energy. Average conditions tend to remain stable unless the Earth experiences a force that shifts the energy balance. A shift in the energy balance causes the Earth’s average temperature to become warmer or cooler, leading to a variety of other changes in the lower atmosphere, on land, and in the oceans.
A variety of physical and chemical changes can affect the global energy balance and force changes in the Earth’s climate. Some of these changes are natural, while others are influenced by humans. These changes are measured by the amount of warming or cooling they can produce, which is called “radiative forcing.” Changes that have a warming effect are called “positive” forcing, while changes that have a cooling effect are called “negative” forcing. When positive and negative forces are out of balance, the result is a change in the Earth’s average surface temperature.
Changes in greenhouse gas concentrations in the atmosphere affect radiative forcing (see the Atmospheric Concentrations of Greenhouse Gases indicator). Greenhouse gases absorb energy that radiates upward from the Earth’s surface, re-emitting heat to the lower atmosphere and warming the Earth’s surface. Human activities have led to increased concentrations of greenhouse gases that can remain in the atmosphere for decades, centuries, or longer, so the corresponding warming effects will last for a long time.
About the Indicator
Figure 1 of this indicator measures the average total radiative forcing of 22 long-lived greenhouse gases, including carbon dioxide, methane, and nitrous oxide. The results were calculated by the National Oceanic and Atmospheric Administration (NOAA) based on measured concentrations of the gases in the atmosphere, compared with the concentrations that were present around 1750, before the Industrial Revolution began. Because each gas has a different ability to absorb and emit energy, this indicator converts the changes in greenhouse gas concentrations into a measure of the total radiative forcing (warming effect) caused by each gas. Radiative forcing is calculated in watts per square meter, which represents the size of the energy imbalance in the atmosphere.
NOAA also translates the total radiative forcing of these measured gases into an index value called the Annual Greenhouse Gas Index (right side of Figure 1). This number compares the radiative forcing for a particular year with the radiative forcing in 1990, which is a common baseline year for global agreements to track and reduce greenhouse gas emissions.
For reference, this indicator also presents an estimate of the total radiative forcing associated with a variety of human activities from 1750 to the present. Figure 2 shows the influence of:
- Tropospheric ozone, a short-lived greenhouse gas.
- Emissions that indirectly lead to greenhouse gases through chemical reactions in the atmosphere. For example, methane emissions also lead to an increase in tropospheric ozone.
- Aerosol pollution, which consists of solid and liquid particles suspended in the air that can reflect incoming sunlight.
- Black carbon (soot), which can make the Earth’s surface darker and less reflective when it is deposited on snow and ice.
- Several other factors, like land use change, that affect radiative forcing.
About the Data
Indicator Notes
The index in Figure 1 does not include short-lived greenhouse gases like tropospheric ozone, reflective aerosol particles, black carbon (soot), or the indirect influence of methane through its effects on ozone formation. Figure 2 includes these and other indirect influences.
Data Sources
Data for Figure 1 were provided by NOAA. This figure and other information are available at: https://gml.noaa.gov/aggi/aggi.html. Data for Figure 2 came from the Intergovernmental Panel on Climate Change (www.ipcc.ch), which publishes assessment reports based on the best available climate science data.
Technical Documentation
References
1. NOAA (National Oceanic and Atmospheric Administration). (2024). The NOAA Annual Greenhouse Gas Index (AGGI). Retrieved November 1, 2024, from https://gml.noaa.gov/aggi/aggi.html
2. IPCC (Intergovernmental Panel on Climate Change). (2013). Climate change 2013—The physical science basis: Contribution of Working Group I to the Fifth Assessment Report of the Intergovernmental Panel on Climate Change (T. F. Stocker, D. Qin, G.-K. Plattner, M. Tignor, S. K. Allen, A. Boschung, A. Nauels, Y. Xia, V. Bex, & Midgley, Eds.). Cambridge University Press. www.ipcc.ch/report/ar5/wg1

