Holistic Watershed Management for Existing and Future Land Use Development Activities: Opportunities for Action for Local Decision Makers: Modeling and Development of Flow Duration Curves (FDC 1 and 2 Projects)
A technical direct assistance project funded by the U.S. EPA Southern New England Program (SNEP)
- Introduction and Executive Summary
- Project Background
- Project Partners and Technical Steering Committee
- Supporting Documentation
- Selected Literature References
- FDC Project Deliverables
- Proposed Project Schedule
- Contacts
Introduction and Executive Summary
As a 'proof of concept' demonstration over the course of two years / two phases, this FDC Project investigated the possibility of developing and applying flow duration curves (FDC) and runoff duration curves (RDC) for addressing watershed impacts resulting from impervious cover (IC).
FDC1 (Phase 1). The first phase of the project entailed watershed and climate characterization as input to a Loading Simulation Program C++ (LSPC) hydrologic model. The LSPC model was calibrated based on a Hydrologic Simulation Program – Fortran (HSPF) model developed by the United States Geologic Survey (USGS) for an earlier USGS Taunton River Watershed Project (Barbaro & Sorenson, 2013). The calibrated LSPC model was then used to derive and validate the FDC for the Wading River watershed in Taunton.
The LSPC model and FDCs were next used to evaluate land use and climate scenarios using a 20-year long-term runoff and loading (RL) time series. These data were subsequently input to EPA's Opti-Tool: a green infrastructure (GI) optimization model (available at: Opti-Tool) to evaluate stormwater management scenarios and water quality (WQ) benefits.
FDC2 (Phase 2). FDCs developed during Phase 1 were subsequently used to derive Runoff Duration Curves (RDC). The RDCs are used to evaluate the effectiveness of next-generation new development and redevelopment (nD/rD) practices - referred to here as "Conservation Development" (CD) practices - when implemented at the site-scale level.
Phase 2 included outreach with participating municipalities within the Taunton River Watershed to consider, among other things, the development of next-generation municipal ordinances and bylaws to incorporate next-generation nD/rD CD practices.
Lastly, the project included a webinar to disseminate technical findings. More detail on Phase 2 of the project is provided here: FDC 2 Project Summary (pdf) .
Understanding FDCs, RDCs, and nD/rD CD Practices
Increases in IC arose over many decades of development activities at the site-scale level and the impact of IC on watershed health and resilience is cumulative. Moreover, such cumulative impacts cannot be realistically addressed at a watershed level; such impacts must be addressed at the site-scale level.
Today, the challenge for watershed and municipal practitioners is to incorporate next-generation nD/rd CD practices at the site-scale level. Implementation of these practices translates essentially into preservation of the pre-development hydrological condition.
CD practices generally include among other things:
- de-emphasis on the use and application of impervious cover (IC),
- incorporation of stormwater control measures (SCM) and green infrastructures / low impact development (GI/LID),
- an increasing role of landscape architecture to achieve enhanced evapotranspiration (ET),
- better geospatial distribution of site runoff,
- preservation of naturally vegetated areas, and
- incorporation of next-generation architecture for increased sustainability (e.g., green roofs).
Flow Duration Cures (FDC). As stated, the Project included development and application of watershed-scale flow duration curves (FDC) for low-order and/or headwater stream segments as an important next-generation watershed optimization management tool. Application of FDCs results in the quantification of associated benefits and impacts occurring from the conversion of vegetated permeable land cover to impervious cover (IC). Such benefits include, among others, greater municipal and watershed resiliency, increased groundwater recharge, and reduced municipal operation and maintenance (O&M). Impacts include, among others, changes to water quality; flooding frequency and duration; drought frequency and duration; and alteration of in-stream channel stability, ecohydrological function, and hydrogeomorphology. An FDC is a cumulative probability distribution of in-stream flow (cfs) (includes base flow).
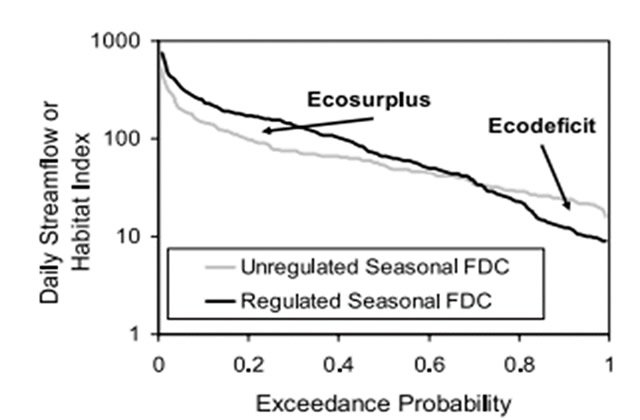
The figure above presents an FDC. The light grey line is the predevelopment condition (referred to here as "unregulated") and the dark grey line is the post-development condition (referred to here as "regulated"). As development occurs, the instream high flows become higher (ecosurplus = flooding) and the instream low flows become lower (ecodeficit = drought).
The area between the two curves represents the 'solution set' of nD/rD CD practices to be implemented at the watershed scale. The objective of the municipal / watershed / stormwater practitioner is to implement as many nD/rD CD practices as practicable and 'drive' the curve back to the predevelopment condition.
Because the developed landscape represents decades of increases in IC, mitigation / reversal of IC must occur cumulatively at the Stormwater Control Measure (SCM) and site-scales to reverse the impact of IC across the watershed/subwatershed. This is why the FDC Project also derived Runoff Duration Curves (RDC).
Runoff Duration Curves (RDC). The development of SCM and site-scale runoff duration curves (RDC) inform on potential management actions at the municipal / site-scale level needed to mitigate and even reverse the cumulative increase of IC across the landscape.
An RDC is also a cumulative probability distribution of stormwater runoff. However, because SCM / site-scale runoff has no baseflow, the curve represents the wet days only.
- SCM RDC. RDC were derived for SCMs which EPA Region 1 had previously developed Performance Curves. EPA's Performance Curves provide an estimation of pollutant removal efficiency for different SCMs. The SCM RDC describes volumetric performance.
Note: an SCM is a Best Management Practice (BMP) for stormwater. Because "BMP" will often describe practices other than practices for stormwater, SCM is used here to identify stormwater practices only. By definition, SCMs are included as nD/rD CD practices but are often specified particularly in part because RDCs were derived for SCM.
The figure below presents an RDC for an infiltration basin on HSG -C soils and an infiltration rate of 0.17 in per hour. Note that this SCM significantly depreciates stormwater runoff volume even under a future climate scenario.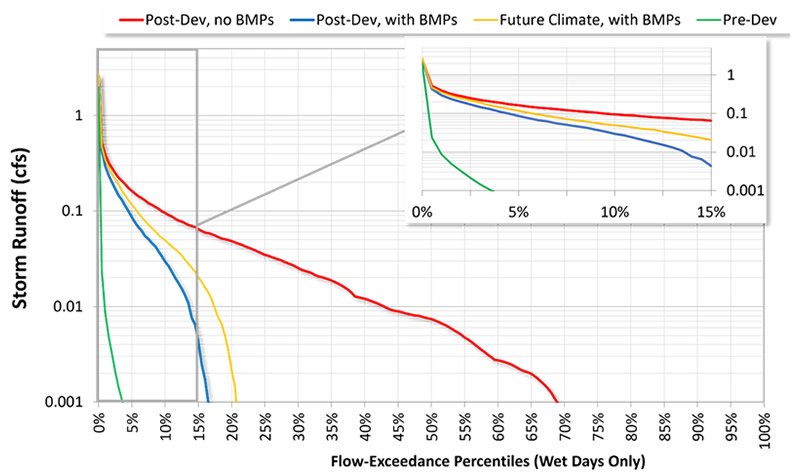
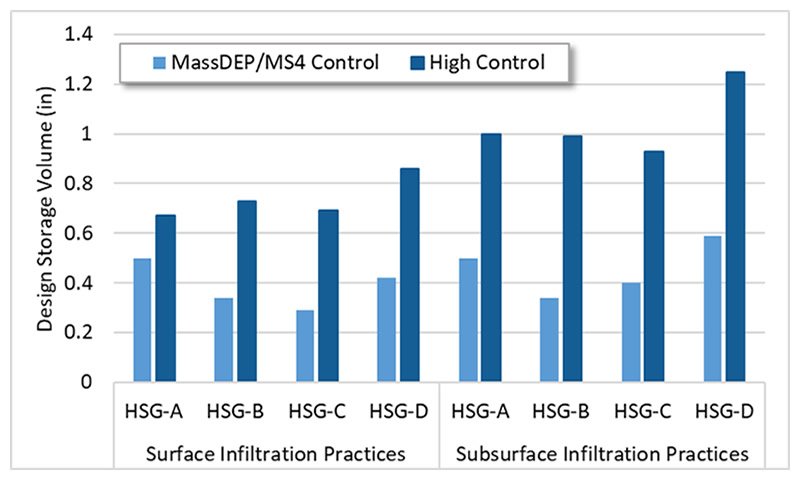
- Site-Scale RDC. SCM and other nD/rD CD practices implemented at the site-scale results in a site-scale RDC. A site-scale RDC demonstrates that development or redevelopment of a given site incorporating nD/rD CD practices achieves the equivalent of a predevelopment hydrological condition. As described in more detail below, as a very general rule of thumb, site-scale nD/rD CD practice implementation will strive to attain a volumetric stormwater control of approximately 1-inch retention volume (not water quality volume).
A site-scale RDC represents the summation of all controls at the site-scale and is a convenient way of demonstrating volumetric control. Implementation of a requisite set of SCM and other nD/rD CD practices to achieve an approximate 1-inch retention volume results in de facto attainment of a predevelopment hydrological condition. This is described in more detail below under the section entitled "FDC Project Results".
FDC Project Results
The results of this project indicate or suggest:
- Impacts of Impervious Cover. Increased IC:
- increases annual runoff volume by approximately 300 to 10,000 percent (0.5 to 1.1 million gallons per acre per year (MG/acre/yr),
- decreases groundwater recharge (GW) by approximately 0.3 to 0.57 MG/acre/yr,
- increases annual stormwater phosphorous load by 400 to 6,500 percent (1.5 to 1.9 pounds per acre per year (Lb/acre/yr),
- increases annual stormwater nitrogen load by 400 to 13,000 percent (11 to 13 lbs/acre/yr),
- decreases evapotranspiration (ET) by more than double the calculated approximate value for GW recharge
Lastly, future climate can amplify or dampen the change in hydrology and water quality (e.g., a wet future climate has more runoff than a dry one).
-
Technical Feasibility of Achieving Site-Scale Pre-Development Hydrology. Next-generation concept designs were developed for three (3) different land use scenarios incorporating different hydrologic soil group (HSG) classifications: (a) high-density residential new development, (b) high-density commercial redevelopment, and low-density residential new development.
The following figure is the RDC for the high-density commercial redevelopment scenario. This figure illustrates that incorporation of SCM and other nD/rD CD Low Impact Development (LID) practices to achieve existing MADEP / MA MS4 permit water quality-based standards has little effect on post-development hydrology (yellow line; "LID MADEP"). However, incorporation of next-generation SCM and other nD/rD CD practices to achieve a higher level of volumetric management control results in a condition identical to the predevelopment condition (blue line; "LID Volume").
This and the other FDC/RDC application scenarios considered for this project indicate impacts of IC may be mitigated – even reversed - if next-generation nD/rD CD practices are incorporated at the site-scale level.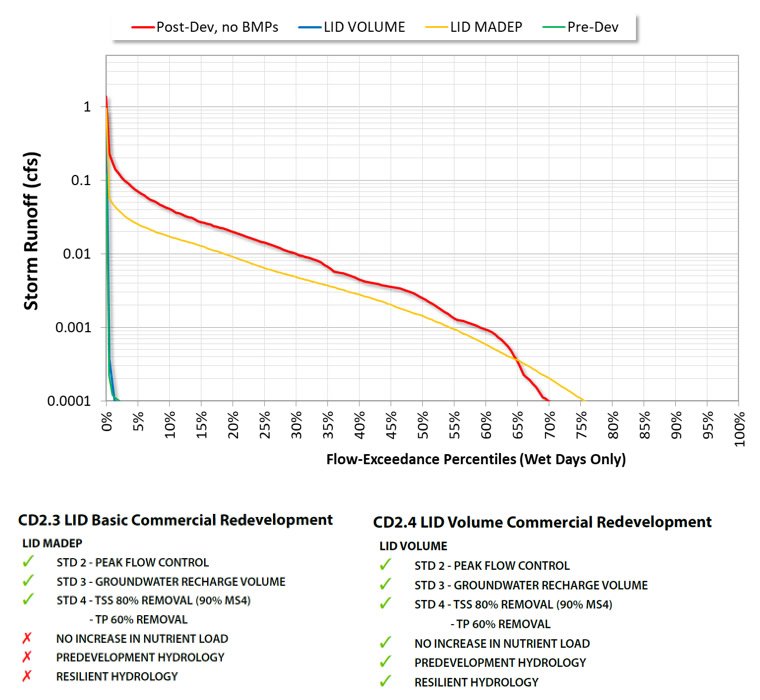
- A Different Goalpost. Incorporation of a 'Watershed Protection Standard (WPS)' equal to an approximate one (1) inch retention standard. It follows that existing water quality standards are unlikely to result in IC mitigation. However, the results of this FDC Project suggest, all things considered, the application of an approximate 1-inch WPS at the site-scale level is both technically and economically feasible.
-
Cost. Next-generation SW permits now require SW load reductions from existing development. Retrofitting SW controls can cost up to four times (4x) the equivalent control during new or re-development. In contrast, nD/rD CD Practices are economically implemented and maintained, all things considered (e.g., municipal O&M offset, decreased chronic and/or acute flooding, offset of gray infrastructure requirement, etc.). Such costs are estimated as follows:
- No Control:* $54,000 – $76,000 per new acre of impervious cover,
- MS4/MADEP Control Level:** $11,000 - $22,000 per new acre of impervious cover,
-
nD/rD CD Practice Control Level:*** $0
* Cost estimates are for construction of SW retrofit controls for existing impervious cover in year 2020 dollars.
** MS4 control level is the more stringent of either 60% SW phosphorus load reduction or MassDEP's 2008 groundwater recharge SW standards.
*** nD/rD CD Practice Control Level means achieving predevelopment annual recharge and nutrient export through dispersed SCM, GI/LID and environmentally sensitive site design.
-
Considerations for Local SW Regulations. A University of New Hampshire study estimates that a 1 acre threshold for triggering SW control will capture only 30 percent of IC whereas triggering SW control at a lesser threshold of 5,000 sq. ft. (i.e., 1/8 acre) would capture 80% of IC.
Other Considerations (from MA Audubon Audit Tool for Zoning, Subdivision, Site Plan Review, and Stormwater Overview).- Goal 1: Protect Natural Resources and Open Space. Limit clearing and grading and encourage soil management, the use of native species, and revegetation of disturbed areas.
- Goal 2: Promote Efficient Compact Development Patterns and Infill. Compact designs by making dimensional requirements such as setbacks, lot size, and frontage more flexible as well as allowing common drives to decrease the impervious surfaces and increase infiltration.
- Goal 3: Smart Designs that Reduce Overall Imperviousness. Site design elements such as street location, road width, cul-de-sac design, curbing, roadside swales, and sidewalk design and location to minimize impervious surfaces and allow for infiltration.
- Goal 4: Adopt Green Infrastructure Stormwater Management Provisions. Low Impact Development structural controls are a preferred method, such as requiring roof runoff to be directed into vegetated areas, and a preference for infiltration wherever soils allow or can be amended.
- Goal 5: Encourage Efficient Parking. Reduce impervious surfaces with standards for required parking - or even including parking maximums instead of minimums.
PROJECT BACKGROUND
Conventional development approaches and existing stormwater management standards (where applicable) do not adequately address the full range of hydrologic, water quality and aquatic life impacts associated with human development and impervious cover ("IC"). The weight of evidence is clear that human development and urbanization have had a profound impact on water resources in multiple ways. The paving of vegetated land disrupts the natural hydrologic cycle at a site scale that has ramifications for the larger watershed. Recent research assessing the health and integrity of watersheds indicates that efforts to restore the hydrological and ecological function of our watersheds are not likely to offset the combined impacts of 1) past and future development that expands watershed impervious cover (IC), and 2) changing climate conditions. For instance, "billions of dollars continue to be invested in the physical restoration of urban channels. [However,] post-construction studies generally show . . . [these streams are in fact biologically] unrestored [except where stormwater control measures have been extensively implemented]." (Hawley; 2015). Watershed management needs to consider the magnitude, frequency, and timing of various flow events – and incorporate new insight on the role of lesser permeability soils (e.g., tills) which indicate such soils provide a primary mechanism for maintaining hydrological balance (Boutt; 2017). As human populations continue to grow, and population centers shift in response to changing natural hazards associated with climate change impacts, appropriate guidance on resource protection is a fundamental need for humans and ecological communities. The Flow Duration Curve encapsulates the full spectrum of hydrologic and hydrogeologic balance needed for assessing and preserving the future health of watersheds.
In brief, the FDC describes the frequency and duration of stream flow rates for a given location that occur over a long period. The FDC is a powerful diagnostic tool for evaluating impacts of watershed development and potential benefits of future management alternatives across the full spectrum of in-stream flow regimes:
- FDCs Quantify Impacts. FDCs can be used to quantify the impacts (change in frequency and duration) to critical flow regimes (e.g., bank-full flow (i.e., flooding), scouring flows (i.e., channel destabilization), base flow (i.e., aquatic life), high pollutant export flows, etc.) for varying levels of development and IC.
- FDCs Quantify Benefits. FDCs can be used to quantify anticipated benefits of alternative development practices and watershed stormwater management alternatives including:
- relevance of existing stormwater standards;
- enhanced Low Impact Development approaches;
- optimized stormwater management solutions emphasizing green infrastructure (stormwater control measures (GI SCM) for both existing and future development conditions; and
- identifying high-value hydrologic/ecological resource areas in which development should be avoided to maintain natural watershed functions essential for future watershed and water resource resiliency.
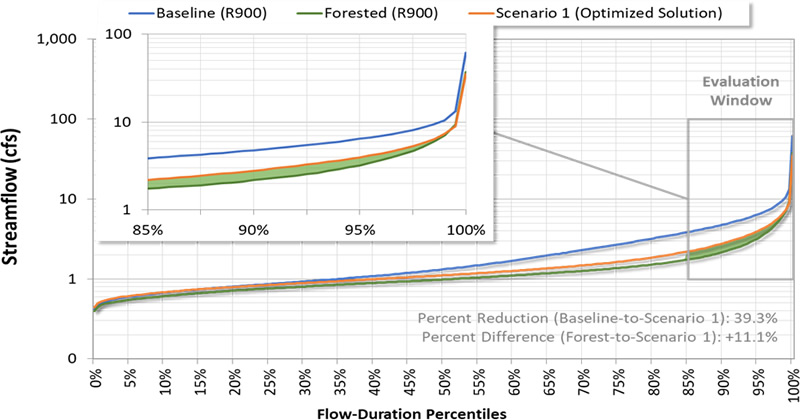
The above figure is an example flow duration curve for predevelopment and existing watershed development conditions, as well as an alternative conservation development management solution. The figure provides an example optimized solution for a given subwatershed after incorporating specific development and management practices in order to normalize the FDC towards the natural hydrologic condition of the forested state. Except for the smaller percentage of larger storm events, the optimized solution demonstrates that the watershed can be hydrologically restored, a condition that translates overall into less geomorphic distortions, reduction in flooding events, and improved water quality. Hydrologic normalization is a precursor for ecological health and restoration.
Project Partners and Technical Steering Committee
Phase I of the project included a Technical Steering Committee (TSC) comprised of members with expertise related to watershed and hydrologic stream flow modelling; geology and hydrogeology; stream ecology; fluvial geomorphology; green infrastructure and stormwater management; land use planning; and landscape architecture. The purpose of the TSC was to provide guidance and feedback to the core project team throughout the project. During the course of the FDC 1 phase of the project, the TSC participated in five (5) meetings to discuss drafts of key deliverables. The FDC 2 phase of the project emphasized municipal engagement; the TSC is anticipated to participate during the workshop at the conclusion of the project. Refer to FDC2A Task 7 Workshop.
The TSC consists of Academia, Consultants, EPA, NGO, States and others (listed alphabetically):
- Boston Society of Landscape Architects
- EPA Contractor, Great Lakes Environmental Center
- EPA Contractor, Paradigm Environmental, Inc.
- EPA Contractor, Waterstone Engineering, PLLC
- EPA Region 1 Water Division's Stormwater Permitting and NonPoint Source Unit
- EPA's Office of Research and Development's Atlantic and Ecology Division, Narragansett, RI
- Fluvial Matters Consulting, University of Vermont
- Scott Horsley Consulting
- Kimberly Groff Consulting
- Massachusetts Department of Environmental Protection
- Rensselaer Polytechnic Institute
- The Nature Conservancy
- Southeastern Regional Planning and Economic Development District
- University of Massachusetts, Amherst, MA
- University of New Hampshire Stormwater Center
- United States Geological Survey, and
- Vermont Department of Environmental Conservation
Supporting Documentation
- EPA Region 1's FDC 1 Performance Work Statement (PWS) (pdf)
- EPA Region 1's FDC2 Performance Work Statements (PWS)
- EPA Region 1 Opti Tool
- EPA Region 1 Stormwater Management Tools
Selected Literature References
Barbaro, J.R., Sorenson, J.R., 2013. Nutrient and sediment concentrations, yields, and loads in impaired streams and rivers in the Taunton River Basin, Massachusetts, 1997–2008: U.S. Geological Survey Scientific Investigations Report 2012–5277; available at https://pubs.usgs.gov/sir/2012/5277/
Bell, Colin D., et al. (2020), Stormwater control impacts on runoff volume and peak flow: A meta-analysis of watershed modelling studies, Hydrological Processes, Vol. 34, Issue 14; available at https://onlinelibrary.wiley.com/doi/10.1002/hyp.13784
Blum, A. G., Ferraro, P. J., Archfield, S. A., & Ryberg, K. R. (2020). Causal effect of impervious cover on annual flood magnitude for the United States. Geophysical Research Letters, 47, Issue 5; available at https://agupubs.onlinelibrary.wiley.com/doi/10.1029/2019GL086480
Boutt, David R. (2016), Assessing hydrogeologic controls on dynamic groundwater storage using long‐term instrumental records of water table levels, Hydrological Processes, Vol 31, Issue 7, available at https://onlinelibrary.wiley.com/doi/full/10.1002/hyp.11119
Hawley, Robert & Vietz, Geoff. (2015). Addressing the urban stream disturbance regime. Freshwater Science. Vol. 35, No. 1; available at DOI: https://www.journals.uchicago.edu/doi/10.1086/684647
Homa, Elizabeth S., Brown, Casey, McGarigal Kevin, Compton, Bradley W., Jackson, Scott D. (2013), Estimating hydrologic alteration from basin characteristics in Massachusetts, Journal of Hydrology 503 (2013) 196–208; available at https://www.sciencedirect.com/science/article/pii/S0022169413006537?via%3Dihub
Palmer, Margaret and Ruhi, Albert (2019), Linkages between flow regime, biota, and ecosystem processes: Implications for river restoration, Science, Vol. 365, Issue 6459; available at https://www.science.org/doi/10.1126/science.aaw2087
Reichold, L., Zechman, E.M., Brill, E.D., Holmes, H., 2010. Simulation-Optimization Framework to Support Sustainable Watershed Development by Mimicking the Predevelopment Flow Regime. J. Water Resour. Plan. Manag. 136, 366–375; available at https://ascelibrary.org/doi/10.1061/%28ASCE%29WR.1943-5452.0000040
Swanson, Steve (2002), Indicators of Hydrologic Alteration, Resource Note 58, National Science and Technology Center, Bureau of Land Management; available at: https://www.blm.gov/sites/blm.gov/files/documents/files/Library_BLMResourceNote58.pdf
Walsh, Christopher J., Roy, Allison H. et al. (2005), The urban stream syndrome: current knowledge and the search for a cure, J. N. Am. Benthol. Soc., 2005, 24(3):706–723; available at DOI: 10.1899/0887-3593(2005)024\[0706:TUSSCK\]2.0.CO;2
Yarnell, Sarah M. et al. (2020), A functional flows approach to selecting ecologically relevant flow metrics for environmental flow applications, River Research and Applications, Vol 36, Issue 2, 318–324; available at https://onlinelibrary.wiley.com/doi/10.1002/rra.3575
FDC Project Deliverables
FDC 1 Project Deliverables
Task 0: Workplan and Schedule
Task 1: Prepare Quality Assurance Project Plan (QAPP)
Task 2: Project Management and Administration
- Subtask 2A. Kickoff Meeting Presentation Slides (pdf)
- Subtask 2B. Conference Calls, Meetings, Project Team Support, and Post-Project Webinar (Ongoing)
Task 3: Technical Steering Committee Meetings
- TSC Meeting 1: Completion of Subtask 4A - Draft Technical Scope Outline (Dec. 18, 2020)
- TSC Meeting 2: Completion of draft Task 5 technical memorandum (May 22, 2021)
- TSC Meeting 3: Completion of draft Task 6 technical memorandum (June 24, 2021)
- TSC Meeting 4: Completion of draft Task 7 technical memorandum (Sept 23, 2001)
Task 4: Coordinate with TSC to Finalize Phase 1 Project Approach
Task 5: Compile Available Data/Information for Taunton River Watershed Modeling Analysis
- Task 5. Final Technical Memo (pdf)
- Task 5. Final Appendix A Meteorological Data (pdf)
- Task 5. Final Appendix B TSC Comments (pdf)
Task 6: Phase 1 Hydrologic Streamflow Modeling Analyses [TBD]
[Draft Technical Memo and Appendix A now available for TSC Review]
Task 7: Phase 1 Hydrologic Streamflow Modeling Analyses
- Phase 1 Stormwater/Hydrologic Management Optimization Analyses
- FDC1 Final Report (pdf)
- Appendices:
FDC 2 Project Deliverables
The FDC 2 Project was developed as two interrelated projects. The intent was to emphasize the communication and municipal engagement aspects of the project, including development of the Conceptual Site Development (CD) Plans and Next-Generation Model Ordinance and Bylaw recommendations. Application Modeling of the FDC developed in FDC 1 would occur in FDC2A and 'feed' the communication / municipal engagement efforts in the companion FDC2B project.
FDC2A: FDC Application Modeling
Task 0: Work Plan and Schedule (pdf)
Task 1: Quality Assurance Project Plan (QAPP) (pdf)
Task 2: Project Management and Administration
Ongoing
Task 3: Technical Steering Committee (TSC) Meetings
- TSC Mtg 1 – June 30, 2022 (merged with Municipal Engagement Meeting No. 2. See FDC2B below)
- TSC Mtg 2 – Sept 2022 (Refer to Sept 29, 2022 Workshop)
Task 5: Opti-Tool Enhancements: Green Roofs and Temporary Runoff Storage with IC Disconnection (pdf)
Task 6: Modeling Analyses for Projected Future Land Development Conditions at Sub-watershed and Site-Development Project Scales; Responsibilities of and Coordination between FDC2A and FDC2B Project Teams
- Subtask 6A. Sub-watershed Modeling and Alternative Management Analysis for Project Future Land Use Conditions (Refer to Subtask 6C Final Report)
- Subtask 6B. Site Development Project Scale Modeling Alternative Analysis (Refer to Subtask 6C Final Report)
- Subtask 6C. Final FDC2A Project Report and Project Summary Overview Draft Final Report
Task 7: Phase 2 Project Workshop / Webinar to SNEP Region (Thurs., Sept 29, 2022)
FDC Project Workshop / Webinar
FDC2B: Next-Generation Watershed Management Practices for Conservation Development
Task 0: Work Plan and Schedule (pdf)
Task 2: Project Management and Administration - Ongoing
Task 3: Municipal Engagement Working Meetings
- Dec 8, 2021: Agenda (pdf)
- June 20, 2022
- Sept 29, 2022 (Refer to FDC2A Task 7 Workshop / Webinar (above))
Task 4, 5 and 6: Draft Final Report
Proposed Project Schedule
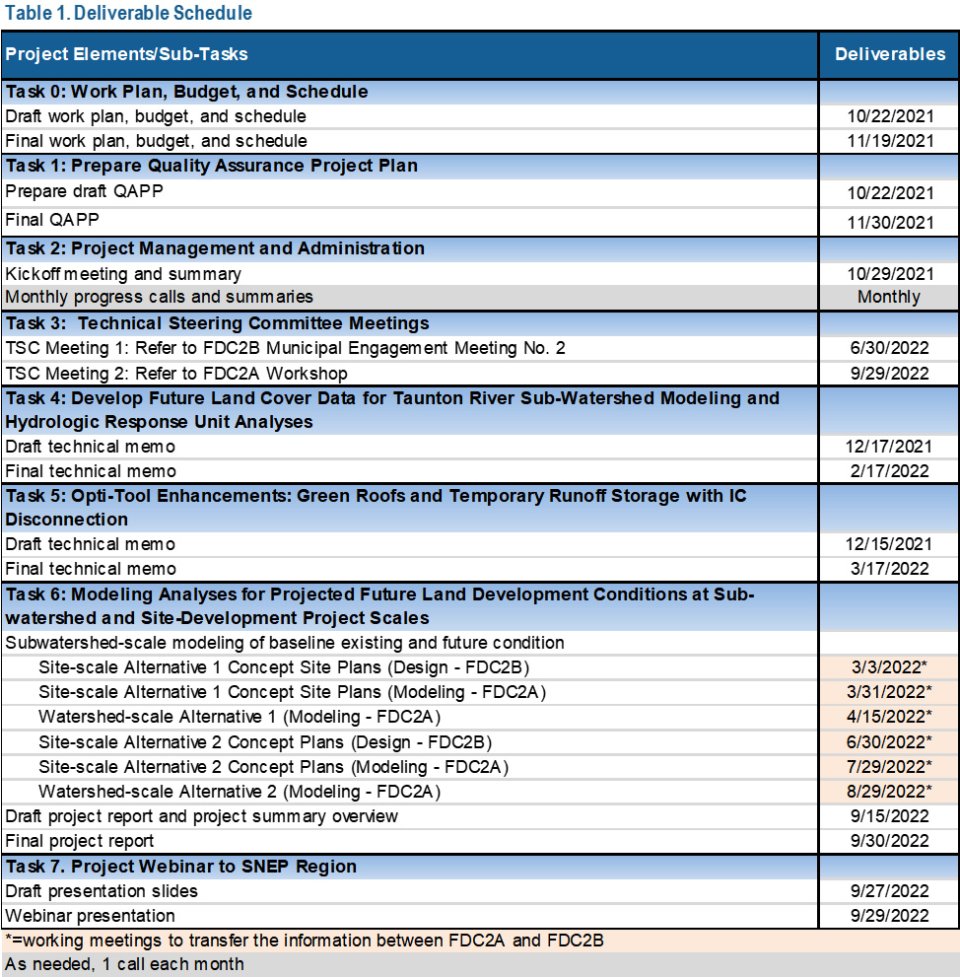
As of Sept 30, 2022, both FDC projects are now completed.
Contacts
USEPA Project Leads
Ray Cody ([email protected])
Surface Water Branch
Phone: (617) 918-1366
Mark Voorhees ([email protected])
Newt Tedder ([email protected])
Michelle Vuto ([email protected])
USEPA SNEP Coordinator:
Ian Dombrowski ([email protected])
Watersheds and Nonpoint Source Unit
Phone: (617) 918-1342
