Random Forest Modeling
On this page:
- What is a random forest modeling?
- Using random forest for making streamflow classifications
- Random forest models in the Regional SDAM web tool
- How the Regional SDAM random forest models were developed
What is random forest modeling?
Random forest is a machine learning model that works by utilizing many decision trees, collectively called a “forest,” to make a prediction. Decision trees can be visualized as a flow chart of conditions that can be used to most accurately classify or predict outcomes. The decision trees yield decisions or model predictions in aggregate by utilizing the collective outcomes of all the trees in the forest.
Using random forest modeling for making streamflow classifications
In the Regional SDAM context, random forest modeling is used to predict the streamflow classification. In the model, each decision tree is a subset of the geomorphological, hydrological, and biological metrics identified by the model as most important for making consistent and accurate classifications of streamflow duration. Each final Regional model uses a forest of 1500 decision trees to make predictions. The forest is preserved in the web tool’s code and there is a unique forest for each region. Entering field measurements for the indicators into the web application returns a streamflow duration classification representing what the majority of decision trees predict. When the model is run with indicator data, each tree in the forest votes on the stream classification.
Random forest models in the Regional SDAM web tool
In the Web Application for Regional SDAMs, users first enter the coordinates of the reach site, identify the location on a map or pick the appropriate region from the drop-down list. This determines the applicable random forest model and associated metric data needed. Next, it identifies the relevant geospatial data for any geospatial metrics included in the model – which may require the user to enter coordinates or pick a location on the map. Users then enter the field data required and click “run model.” The web tool inputs the geospatial metrics calculated based on location and field data entered into the appropriate random forest model resulting in the site’s predicted flow classification. The entered data and the location-specific geospatial metric values are run through all 1500 decision trees.
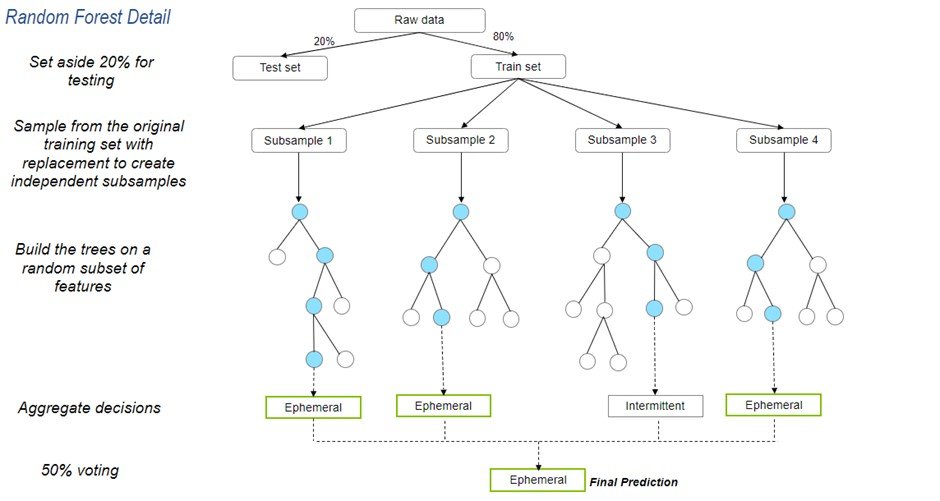
The decision trees each produce a classification decision and yield final predictions in aggregate, by combining the results of all the trees. If 50% or more of the trees agree on a single class – perennial, intermittent, or ephemeral – then that class is the final prediction. If no single class is greater than 50% of the trees and perennial is greater than ephemeral, the outcome is at least intermittent. If no single class is greater than 50% of the trees and ephemeral is greater than perennial, the outcome is less than perennial. Finally, if no class is greater than 50%, and perennial is equal to ephemeral, the outcome is “needs more information”.
Instead of the random forest model, a classification table and decision tree were used to make classification predictions for the beta Arid West and Pacific Northwest methods, respectively. In these instances, it was feasible to use these simpler classification tools instead of a random forest model.
How the Regional SDAM random forest models were developed
The data collected in the field and from geospatial metrics (e.g., precipitation, temperature) were used to develop the random forest models for each of the Regional SDAMs. The resulting data were split into testing data (20%) and training data (80%). Training data were fed into the model to recognize patterns and “train” the model to identify streamflow duration classes. Once the model was built with the training data, testing data were used to evaluate performance and inform model selection and refinement decisions. The testing data were kept separate from the training dataset to ensure an independent evaluation of model accuracy using data previously unseen by the model.
While there were dozens of candidate metrics considered for use in each of the regional SDAMs, the number of metrics ultimately selected as final indicators to be included in the random forest model is much smaller. Recursive feature elimination was used to select the metrics in each training dataset that are most relevant to making an accurate classification prediction. All possible metrics were provided at the start, and the least important ones were dropped in a stepwise process. The smallest subset of metrics that yielded an accuracy within 1% of the highest accuracy subset was selected. Then, additional refinements were made to the final indicators to make it easier to implement in the field by using fewer or simplified indicators (presence/absence, binned values, etc.) without losing accuracy when applying the model to the testing data.

This is a conceptual illustration of a random forest model. Each tree in the random forest represents an independent subsample, comprised of a subset of training visits and subset of candidate metrics selected randomly. By repeatedly sampling data with replacement from the original training dataset, each decision tree was trained on a different random sample of the dataset. Having decision trees that are uncorrelated, or different from one another, reduced the variance of predictions and improved performance. Each tree has nodes, represented as blue circles, that connect to one another through branches (sometimes referred to as descendants). Each split (from node to node) represents an indicator and associated split value. Some SDAM indicators may have multiple discrete values or a continuous spectrum of possible values that may be used at multiple nodes in an individual tree in the random forest model. The final prediction or classification is based on majority voting from the classifications of all 1500 trees, the “aggregate decisions.”
Note, since the 1500 trees in the random forest model are not using the exact same subsample of indicators, the relationship between any one indicator value and the resulting classification can be quite complex and dependent on the relationship between indicators represented in each of the 1500 decision trees.
